Reimbursement Review
Finerenone (Kerendia)
Sponsor: Bayer Inc.
Therapeutic Area: Heart Failure
*Note, this is a methodological demonstration only.
This report is a portfolio project demonstrating probabilistic record linkage, multiple imputation, Bayesian health economic modeling, and statistical process control methodology. All patient-level data is entirely synthetic. Finerenone and any associated trials are referenced by name to establish plausible clinical context. No real patient-level results, CDA conclusions, or Bayer pricing are reproduced anywhere in this document.
1. Executive Summary
Heart failure (HF) is a disorder where the heart is unable to pump blood throughout the body to maintain the metabolic needs of tissues and organs. In Canada, HR is the third most common reason for hospitalization, and it is estimated that more than 750,000 individuals in Canada live with HF. This condition is particularly burdensome amongst older adults. Current treatment options for HF are diverse. Options may include sodium-cotransporter-2 (SGLT2) inhibitors, like empagliflozin; off-label medications, like angiotensin II receptor blockers; and other antidiabetic drugs. However, treatment goals extend beyond simply addressing the symptoms. Clinicians seek to help patients increase their energy, their strength, and their ability to participate in daily activities.
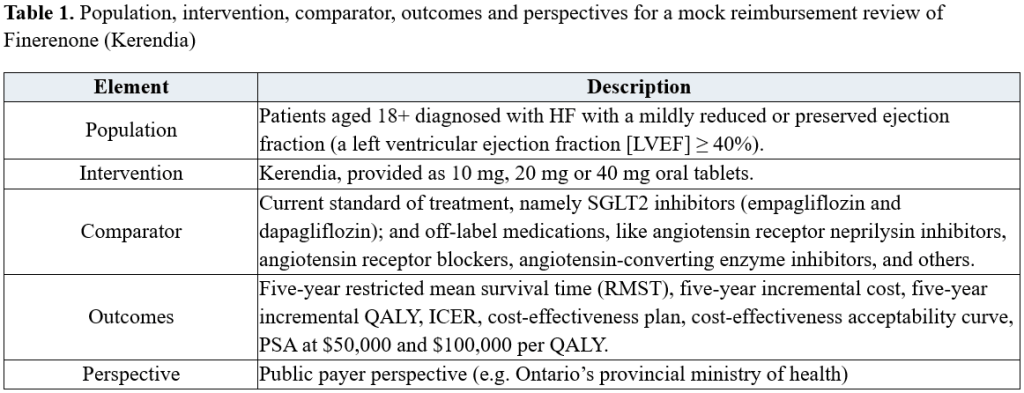
One of the newest treatment options, named Kerendia, has been showing promising clinical evidence for the treatment of HF with a mildly reduced or preserved ejection fraction (a left ventricular ejection fraction [LVEF] ≥ 40%). This is a drug containing Finerenone, available as 10 mg, 20 mg, and 40 mg oral tablets, with the goal of reducing the risk of cardiovascular death, hospitalization, and urgent ER visits. This review seeks to evaluate the compare the effects of Kerendia to standard therapies, namely SLGT2 inhibitors and other off-label treatments.
Three separate and imperfect synthetic data sets were probabilistically linked into a single analytic file. These data sets were a clinical registry, an administrative utilization database, and a cast database. Missing data was addressed through multiple imputation. A Bayesian economic model was used to estimate the incremental cost and quality-adjusted life years (QALYs) associated with Finerenone by incorporating uncertainty in both survival extrapolation and cost estimation. Finally, a statistical process control (SPC) chart was used to monitor a real-world service disruption in hyperkalemic / renal monitoring uptake to determine if this kind of surveillance can reliably flag real-world deviations.
Key Findings
- Probabilistic linkage successfully matched 97.0% of clinical patients to administrative data and 96.6% to cost data.
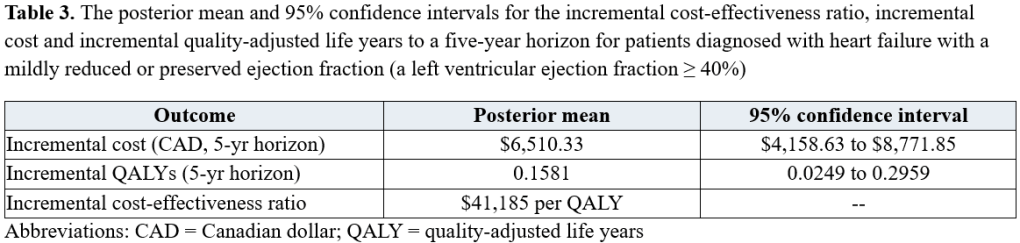
- The posterior mean incremental cost of Finerenone vs. standard therapy alone was $6,510 CAD (95% confidence interval [CI] $4,158 to $8,772) over a five-year extrapolated horizon.
- The posterior mean incremental QALY gain was 0.158 (95% confidence interval [CI] 0.025 to 0.296).
- The resulting incremental cost-effectiveness ratio (ICER) was approximately $41,185 per QALY gained, below CADTH’s typical $50,000 / QALY reference-case threshold.
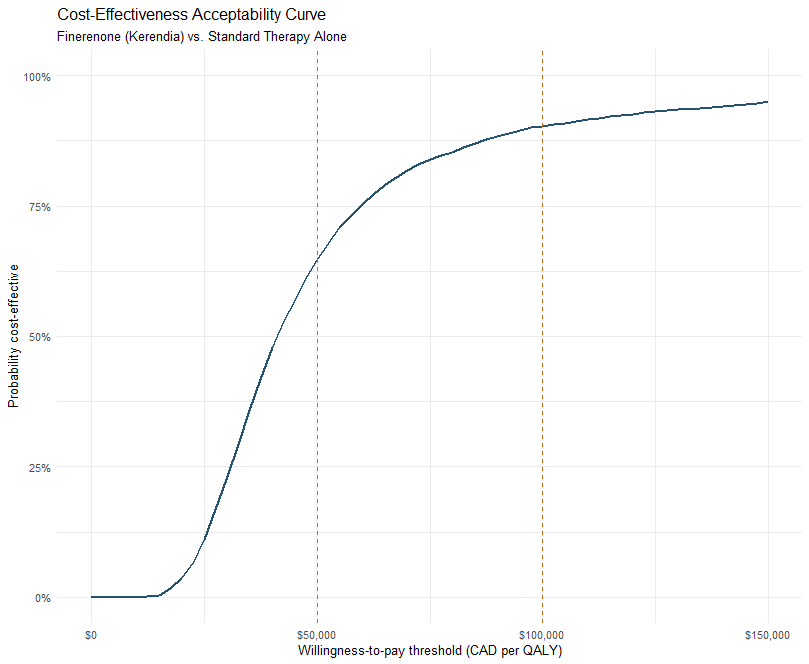
- At a willingness-to-pay (WTP) threshold of $50,000 per QALY in probabilistic sensitivity analysis (PSA) simulations, Kerendia was cost-effective in 64.8% of simulations. Kerendia was cost-effective in 90.2% of simulations at $100,000 per QALY.
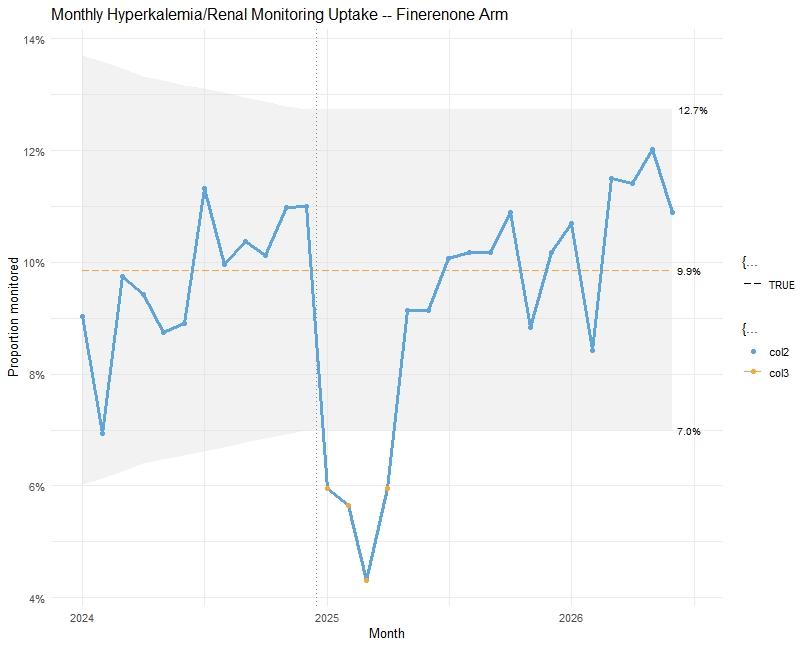
- SPC monitoring of hyperkalemic / renal monitoring uptake showed a correctly detected four-month simulated monitoring disruption between January 2025 to April 2025. This demonstrates that this kind of surveillance can reliably flag real-world deviations from the assumptions built into the economic model.
2. Materials and Methods
2.1 PICO
2.2 Data sources
Three synthetic databases were generated for a cohort of 2,000 simulated patients, deliberately without a shared unique identifier, to mirror the reality that clinical registries, administrative claims, and costing systems in most health systems are maintained separately and must be linked together using indirect identifiers.
- Clinical registry (by patient): registry ID, date of birth, sex, postal code, New York Heart Association (NYHA) classification, LVEF %, diabetes status, treatment type, enrollment date, presence of a hyperkalemic event, presence of a hypertensive event, and others.
- Administrative utilization database (by encounter): administration ID, date of birth, sex, postal code, income quintile, rurality, physician billing code, and others.
- Cost database (by transaction): cost record ID, date of birth, postal code, cost (CAD), service date, cost category, and others.
Realistic linkage noise was injected into indirect identifiers (date of birth, postal code) to require probabilistic linkage rather than exact-match merges. Approximately 5% of administrative records had a date-of-birth data-entry error. Approximately 3% had a postal code error.
Probabilistic linkage was performed using the Fellegi-Sunter method, which estimated match probability from a joint agreement pattern across several fields using an Expectation-Maximization (EM) algorithm rather than requiring exact agreement.

2.3 Missing data
Multiple imputation was used to address missing data for variables with significant proportions of missingness. Variable-specific assumptions were made about the missingness mechanism. These variables were:
- Cost values (~10% missingness at the record level). This was imputed via predictive mean matching, conditional on cost category and rurality. Rurality was included as rural sites in the real-world underreport cost details and was therefore assumed to drive missingness. This missingness was determined to be missing-at-random (MAR).
- Diabetes status (~18% missingness at the encounter level). This was imputed via logistic regression under the assumption that earlier-enrolled patients had less complete comorbidity documentation. This missingness was determined to be missing-not-at-random (MNAR)
- Income quintile (~22% missingness at the encounter level. This was imputed via a proportional odds ordinal model under the assumption of MNAR.
2.4 Statistical analysis
QALYs were derived by applying illustrative, non-published utility weights by NYHA class (II = 0.80, III = 0.68, IV = 0.55), with a temporary disutility of -0.10 applied for 21 days around each HR hospitalization event. These assumptions are hypothetical and not drawn from any cited source.
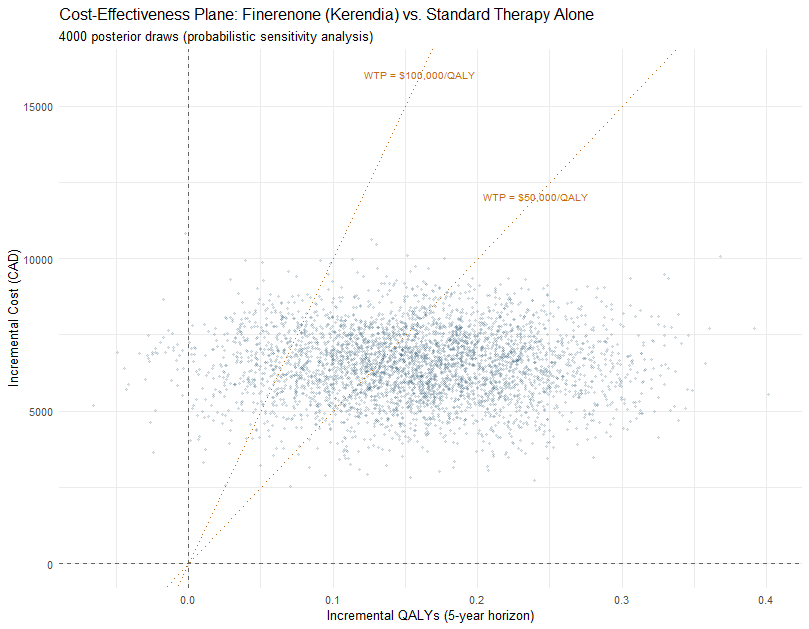
The economic evaluation involved two Bayesian models being fit. First, a Weibull survival model, right-censored at the administrative data cutoff, was fit to extrapolate the RMST to a five-year horizon. This was necessary to allow the analysis to incorporate genuine posterior uncertainty in the survival extrapolation. Second, a Gamma regression model was fit to extrapolate total patient-level cost to a five-year horizon. This methodology was appropriate given the right-skewed, strictly positive nature of our health care cost data. This model was restricted to the 96.6% of patients that were linked to the cost database. The small proportion of patients who failed linkage were excluded from the cost model to avoid biasing the cost distribution towards the null. Posterior draws from both models were then combined to build a joint posterior distribution to calculate the incremental cost and QALY, and to visualize the cost-effectiveness plane and cost-effectiveness acceptability curve.
All statistical analyses were conducted using RStudio (Posit Software, PBC, Boston, MA).
2.6 SPC monitoring of a real-world service disruption
A special-cause signal, specifically a hypothetical four-month lab-capacity service disruption reducing completed monitoring events by 45%, was simulated to determine if SPC monitoring could detect a real deviation in hyperkalemic / renal monitoring for patients diagnosed with heart failure with a mildly reduced or preserved ejection fraction (LVEF ≥ 40%).
A monthly p-chart is to be created to track the proportion of Finerenone-arm patients under active follow-up who received at least one potassium / renal monitoring lab draw each month. The chart was restricted to a post-enrollment ramp-up steady state period starting January 2024. A 2023 enrollment ramp-up period would produce a mechanical upward trend unrelated to monitoring practice, thereby biasing our baseline away from the null.
3. Results
3.1 Economic Evaluation
The Weibull survival model calculated the posterior mean RMST for patients diagnosed with heart failure with a mildly reduced or preserved ejection fraction (a left ventricular ejection fraction ≥ 40%) to be 3.08 years for Kerendia-recipients and 2.86 years for standard therapy-recipients. Using these values alongside the Gamma regression model to calculate total patient-level costs, the incremental cost to a five-year horizon was $6,510.33 (95% CI $4,158.63 to $8,771.85). The incremental QALY to a five-year horizon was 0.1581 (95% CI 0.0249 to 0.2959). This results in an ICER of $41,185 per QALY, a value under the recommended $50,000 per QALY suggested by the CDA. These results can be seen in Table 3.
A cost-effectiveness plane (Figure 1) was constructed using the values obtained from the Weibull survival model and the Gamma regression model. The direction of the WTP thresholds, relative to the standard therapy alone at 0.0, suggest an increase in cost but also an increase in health outcomes.
A cost-effectiveness acceptability curve (Figure 2) was constructed to inform a PSA narrative. Across 4,000 posterior draws, Finerenone (Kerendia) was cost-effective in 64.8% of simulations at a WTP threshold of $50,000 per QALY. Furthermore, Kerendia was cost-effective in 90.2% of simulations at $100,000 per QALY.
3.2 SPC monitoring of a real-world service disruption
The p-chart (Figure 3) shows a stable and in-control pre-disruption period, where month-to-month fluctuation remained within the control limits starting from the baseline period in 2024. The chart flags a special cause variation starting January 2025 and ending April 2025, coinciding with the simulated signal that was created as a test. Following the service disruption, there was a milder, sustained shift in recovery period that settled slightly above the original baseline rate after mid-2025. This may represent increased vigilance regarding hyperkalemia / renal monitoring from patients following the service disruption and would warrant increased investigation.
4. Conclusion
This project demonstrates an end-to-end health data analytics pipeline that spans a probabilistic multi-database linkage, multiple imputation under mixed MAR and MNAR assumptions, Bayesian cost-effectiveness analysis modeling with explicit survival-extrapolation and cost-distribution uncertainty, and statistical process control monitoring of a simulated real-world service disruption.
Finerenone (Kerendia) demonstrated a modest incremental QALY gain at a moderate incremental cost, yielding an ICER below the CDA’s typical reference-case WTP threshold in most PSA simulations. Separately, the SPC monitoring showed that a simple and low-cost control chart would be capable of detecting a real service disruption in safety-monitoring behavior in patients diagnosed with heart failure with a mildly reduced or preserved ejection fraction (LVEF ≥ 40%).
4.1 Limitations
Given the nature of this project, there are several limitations that could be improved upon. First, the linkage error was not fully resolved. About 3-4% of patients were unable to be confidently linked and were excluded from downstream models. In a real-world analysis, it would be useful to flag these patients for manual clerical review such that they can be included in the analysis. Second, the imputation assumptions are unverifiable from the data alone. Multiple imputation techniques formally assume MAR. The MNAR assumptions for diabetes status and income cannot be tested empirically, so there may be residual bias influencing our results. Third, the Weibull survival model and Gamma regression models were fit independently instead of jointly. This methodology created a simplified approximation of an applied Bayesian cost-effectiveness analysis. In the future, a fully joint model should be applied to propagate any correlation between the cost and survival models more rigorously.
Funding
No funding was used to support this mock study.
Author Contributions
Charles Jia (CJ). Conceptualization: CJ. Data curation: CJ. Data analysis: CJ. Writing – original draft: CJ. Writing – review and editing: CJ.
Disclosures
The author reports no disclosures.
Data Availability
A .csv formatted version of the data used within this study can be found below.
Code Availability
The code used within this data can be found at the associated github repository here.

